Upstox · Watchlist · Data as of 11 November 2026
Watchlist redesign that drove 5.2× more orders
A three-release redesign of the Upstox Watchlist, shaped by trader research and product data.

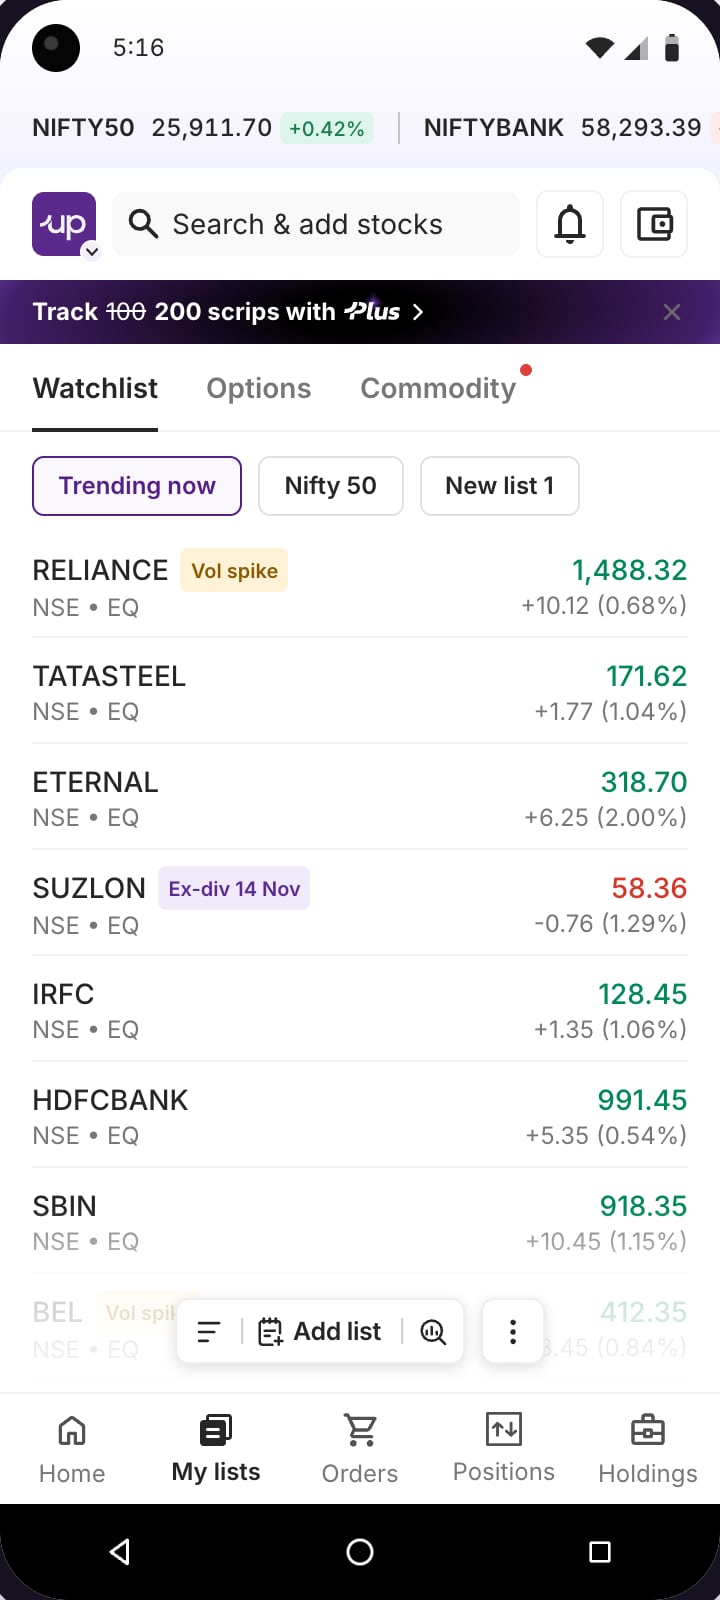
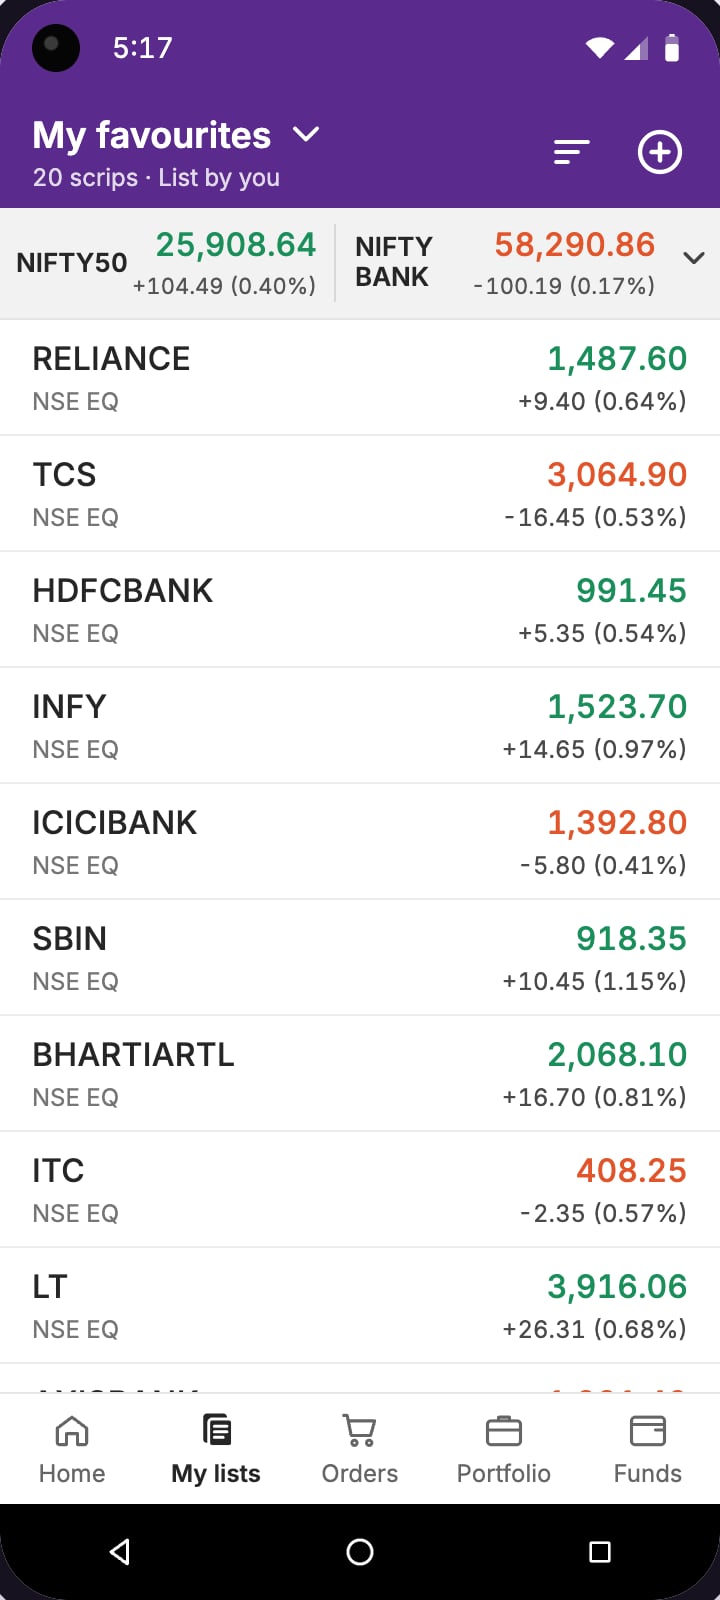
Drag across the screen to compare
- Orders from Watchlist rows
- +420.8%
- 2,34,492 → 12,21,288
- Watchlist tab opens
- +138%
- 11,89,390 → 28,30,703
- New lists created
- +2,038.2%
- 29,166 → 6,23,631
Mixpanel event counts, not unique users. Watchlist tab opens counts every time someone tapped the Watchlist tab. Before: everything before the June 2026 release. After: the June 2026 release to 11 November 2026.
After the June 2026 redesign, orders placed directly from Watchlist rows increased by 420.8%. New lists created grew from 29,166 to 6,23,631. I led the work from research through launch, rethinking how traders create and switch lists, discover what to track and analyse multiple stocks. We shipped the redesign in three releases between June and October 2026. A fourth iteration is now in development, based on feedback from traders using the new experience.
- Team
- SalaathLead product designer
- GitikaProduct designer
- JayeshProduct manager
- Releases
- Release 1June 2026
- Release 2August 2026
- Release 3October 2026
- Status
- Three live, a fourth in build
[ Baseline and opportunity ]
People could open the Watchlist. The hard part was getting things done.
Where the old screen got in the way

[ Research and findings ]
The research pointed to five jobs the Watchlist wasn’t supporting well.
Research inputs
- 1,19,080new customers followed from sign-up to first orderNov 2025 cohort
- 43 vs 16stocks added per person by F&O traders vs everyone elseNov 2025
- Jan–Apr 2026four months of watchlist events on AndroidMixpanel
- 65trader sessions at our office, over six monthsSessions
What traders kept asking for · paraphrased from sessions
- Give me a list to start with, I don’t know what to addReady-made lists
- Let me jump between my lists without opening a menuSwitching lists
- I don’t know where to make a new list fromCreating lists
- Show OI and IV in the list, not three screens deepMore columns
- I want to see all my charts together before the market opensCharts
- Put the option chain next to my listsOption chain
What each app’s watchlist could do
| App | Ready-made lists | Signals on rows | Lists by trading style | Option chain shortcut | Multi-column view | Chart grid |
|---|---|---|---|---|---|---|
| – | – | – | – | – | – | |
| Upstox2023–25 |
A dash means the app wasn’t part of the feature scan. Old Upstox gets a dot for ready-made lists because smartlists existed; hardly anyone found them.
Dhan India

[ Release 1 · June 2026 ]
The first release made everyday Watchlist tasks easier to find.
The key decision
Keep the main action in the floating bar
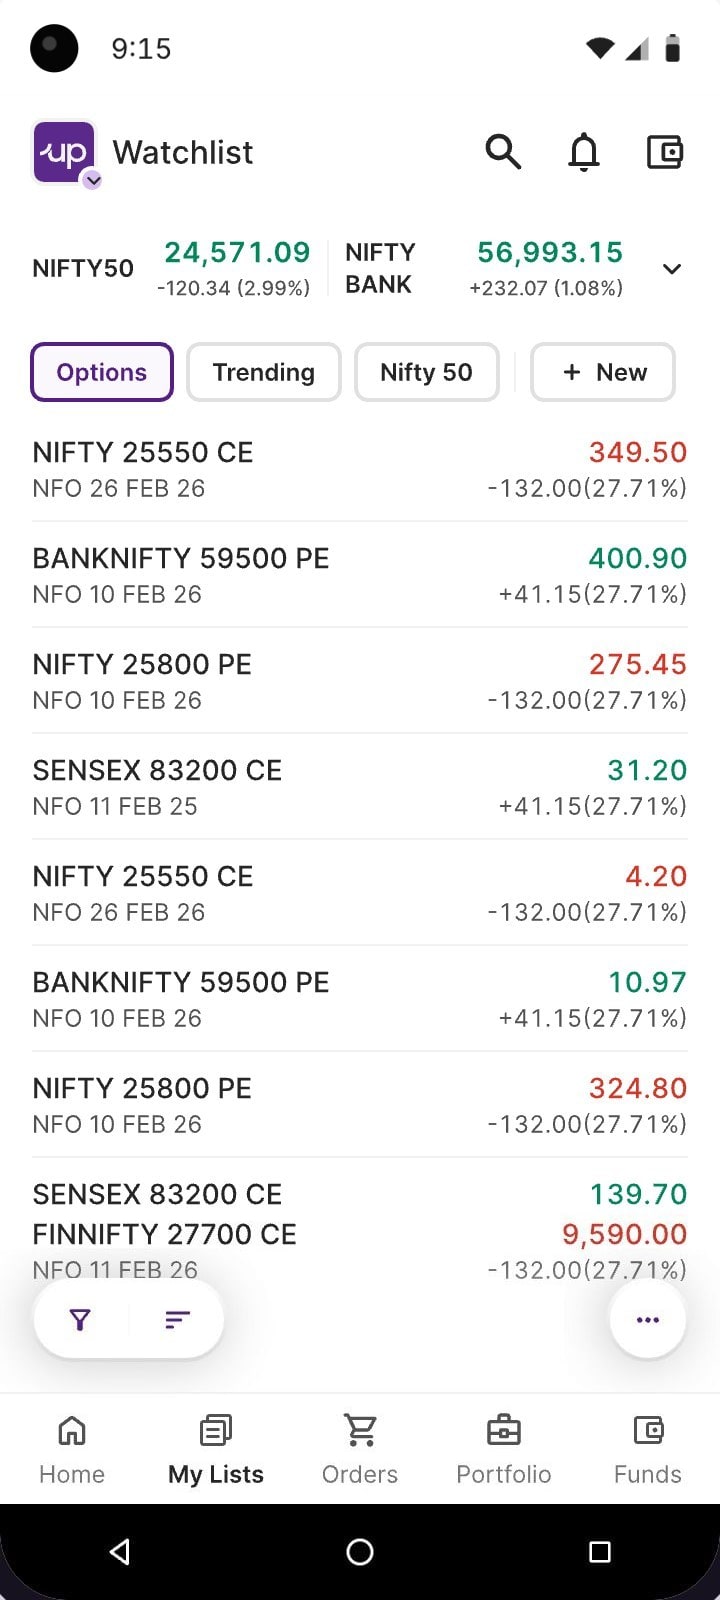
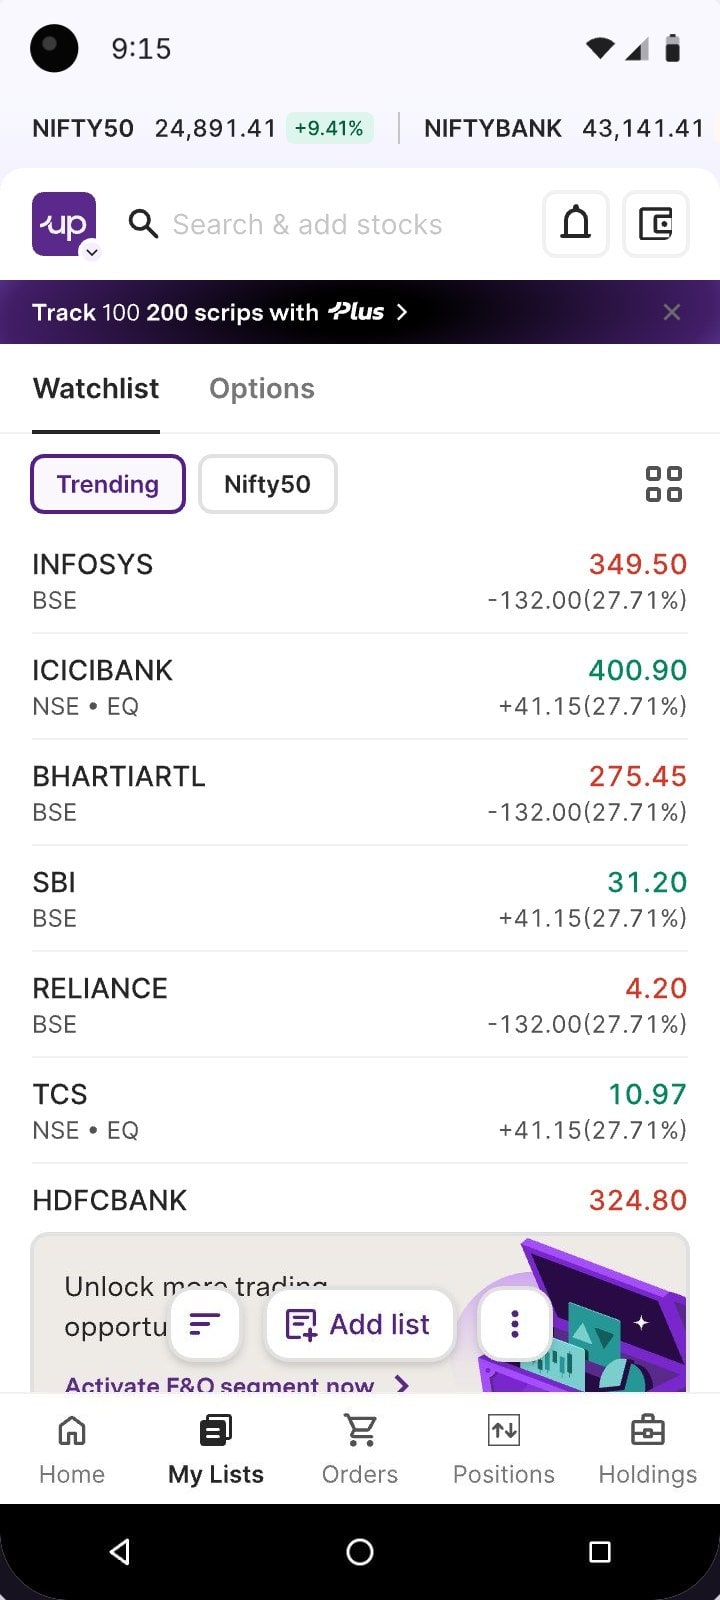
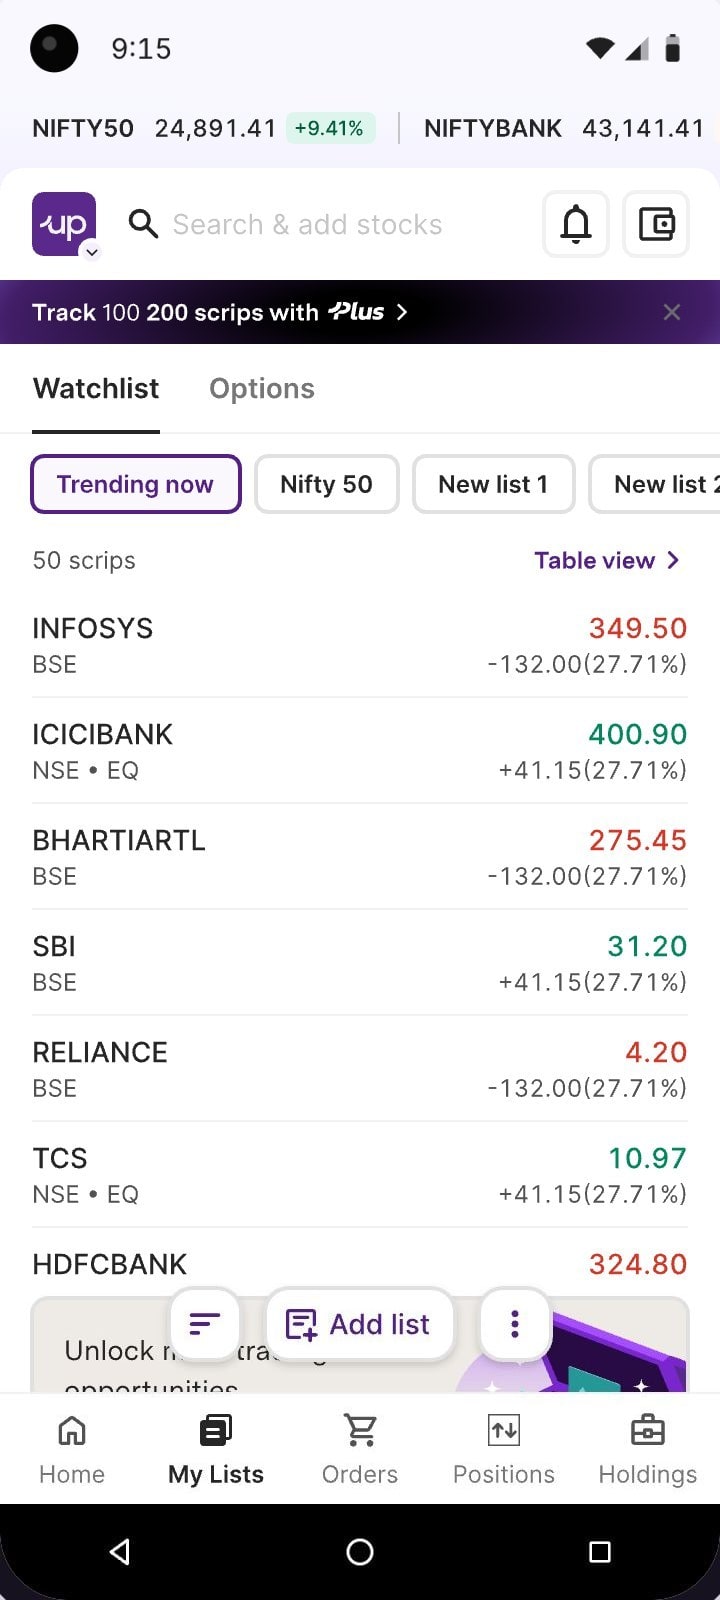
Our first design put + New beside the chips. Every Upstox tab keeps its main action in the floating bar, so it moved there as Add list.
The rule
Each tab’s main action lives in its floating bar. On My lists, the main action is making a list.
- Create a list. + New sits at the end of the chips, up with the lists themselves.
- Floating bar. The floating bar holds filter, sort and a menu: tools for reading a list, not making one.
Went live
Release 1 · What shipped
Live sinceJune 2026
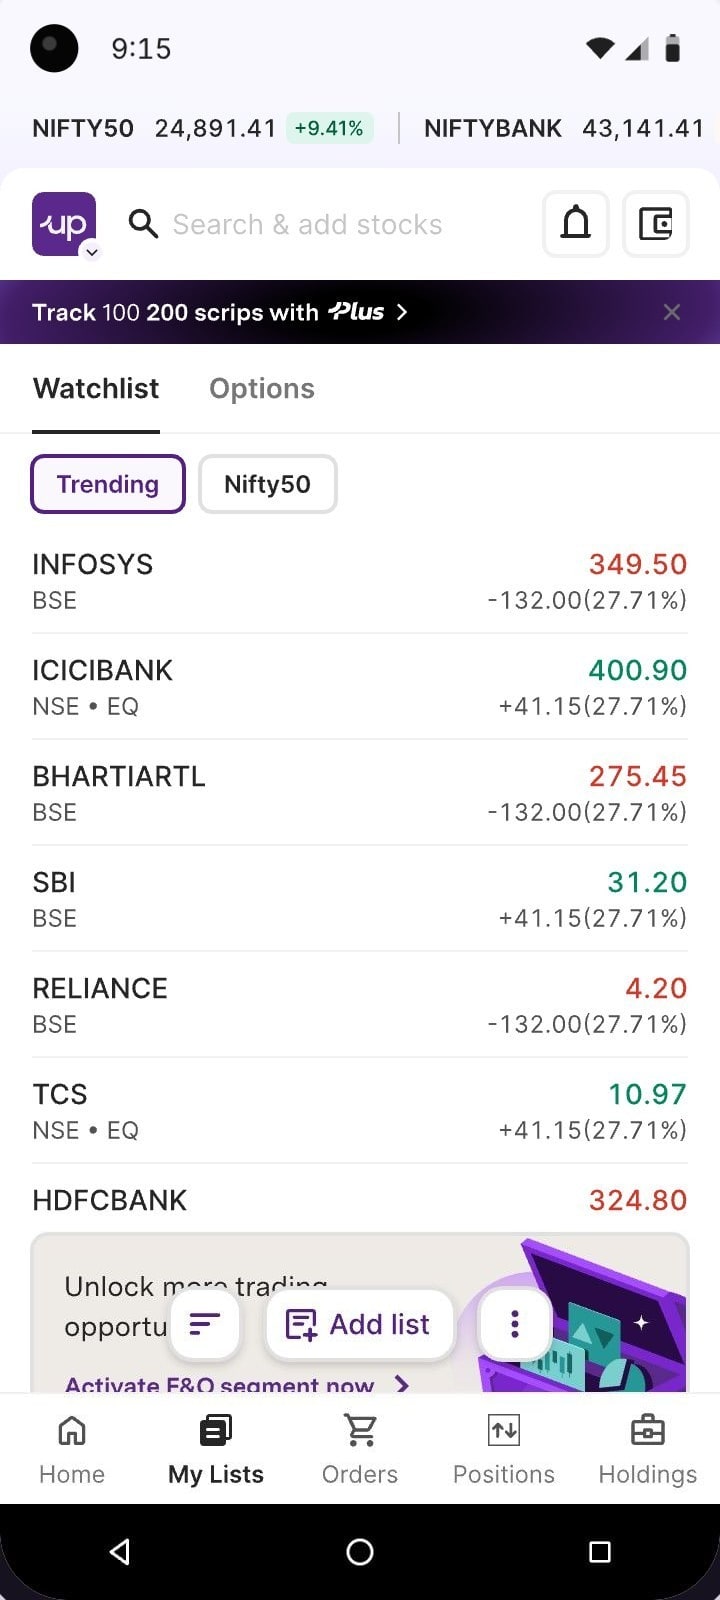
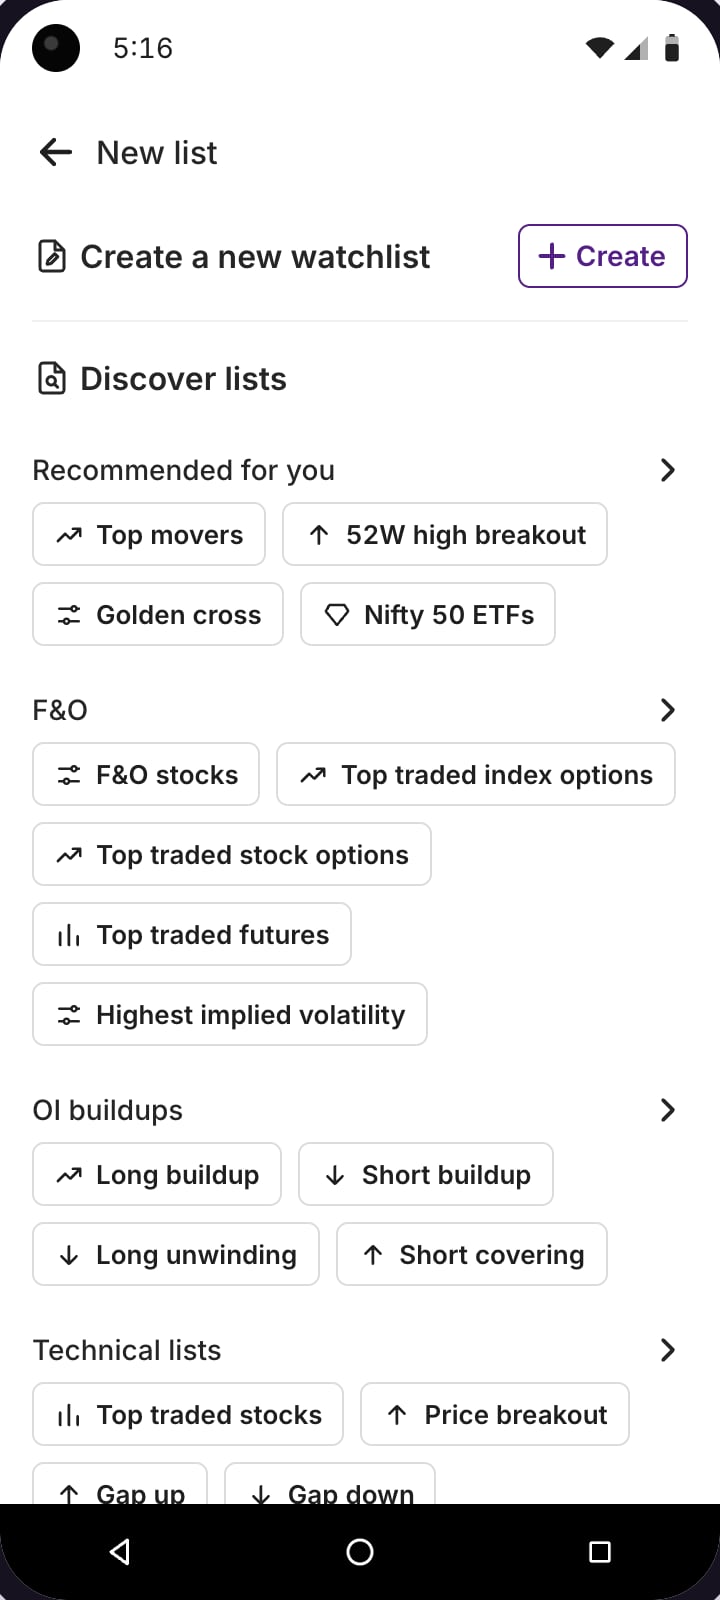
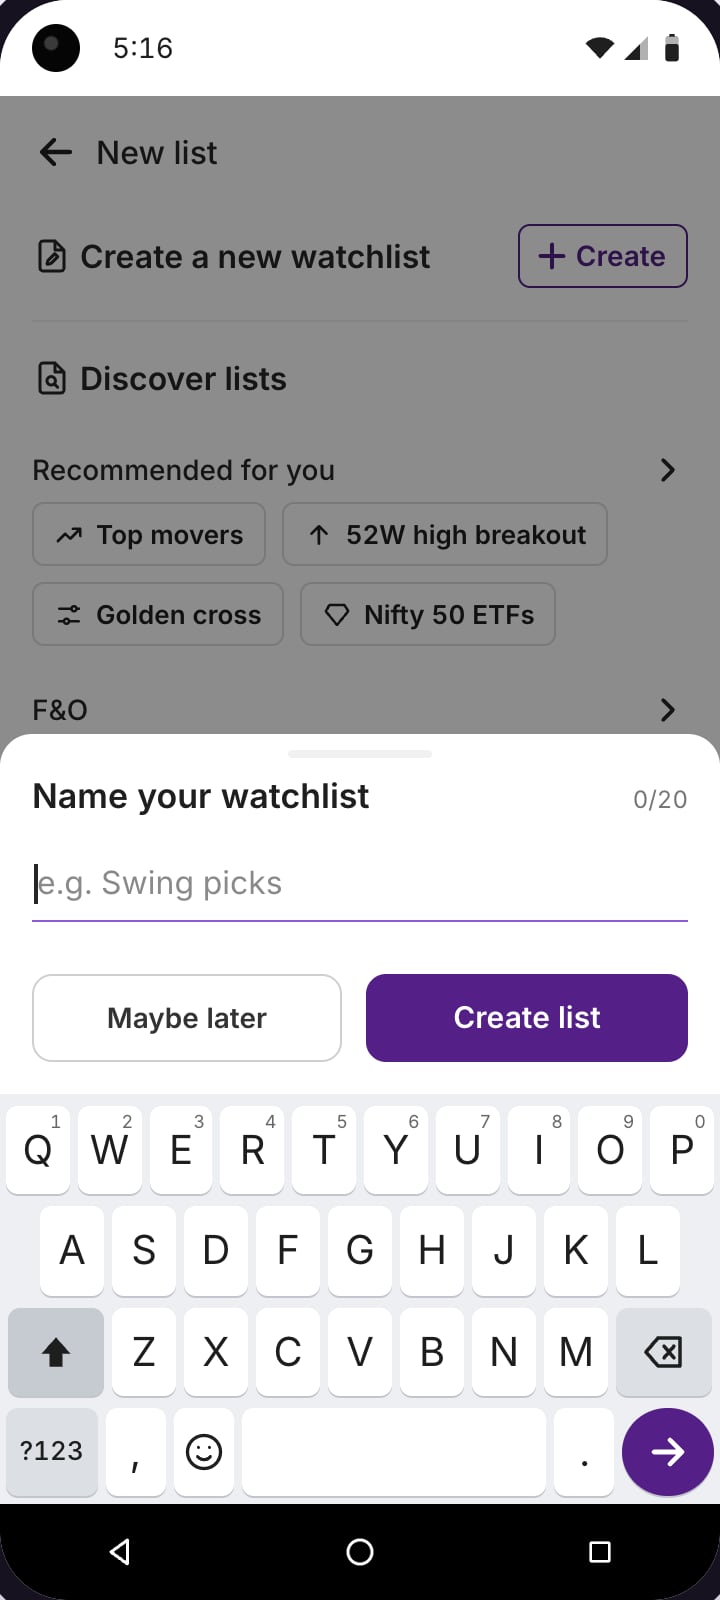
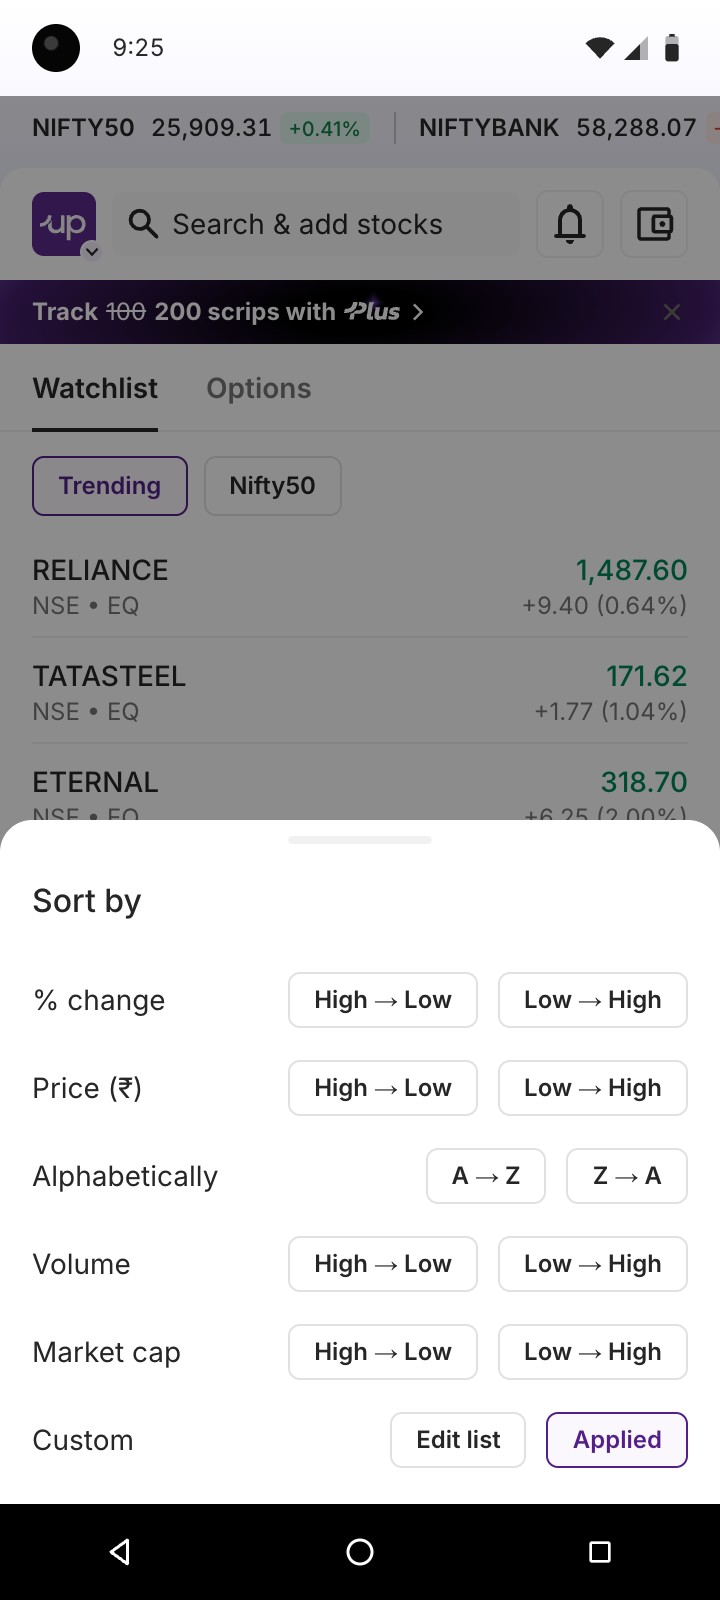
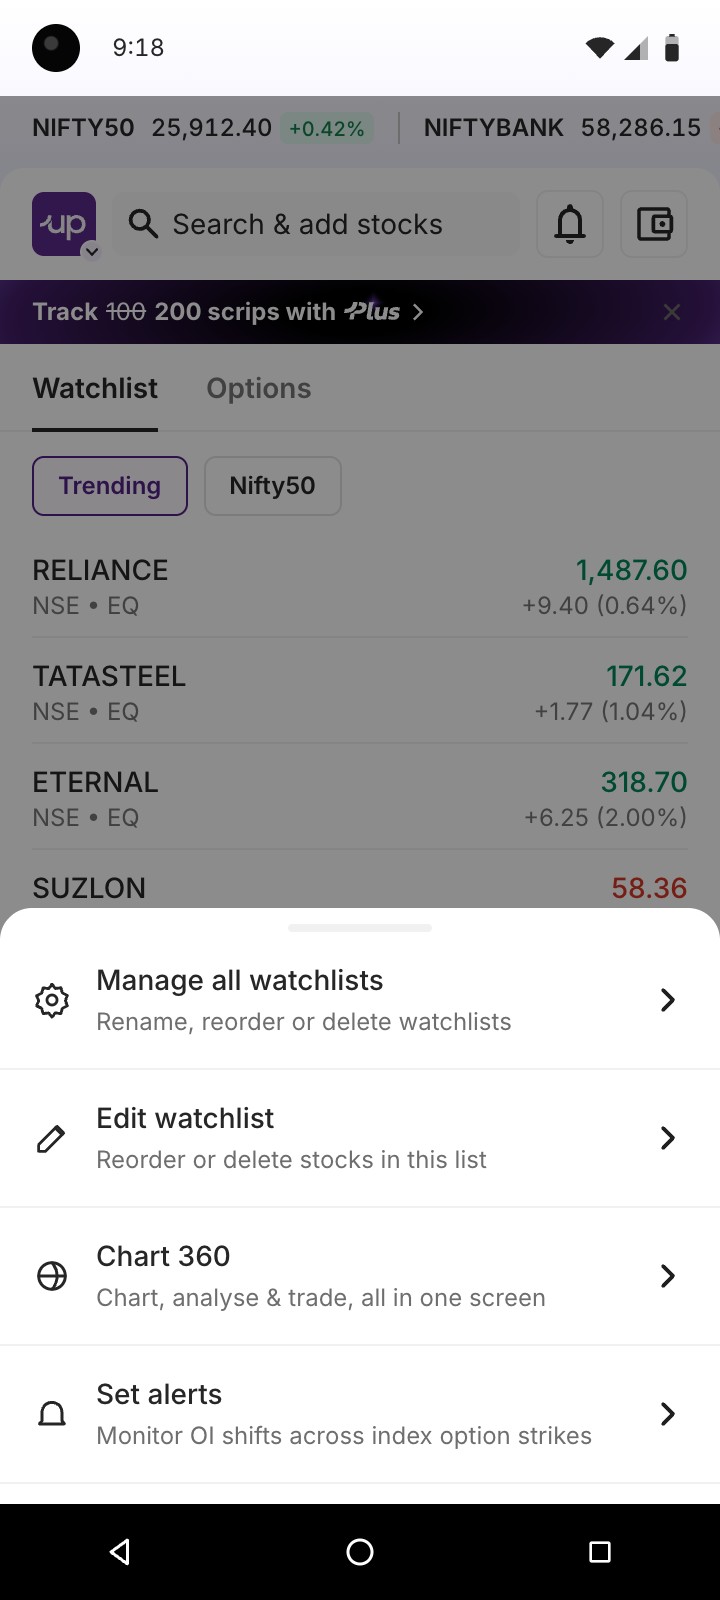
After launch in June 2026
| Behaviour | Before | After | Change |
|---|---|---|---|
| Watchlist tab opens | 11,89,390 | 28,30,703 | +138.0% |
| Added a stock | 33,64,006 | 48,07,095 | +42.9% |
| Created a new list | 29,166 | 6,23,631 | +2,038.2% |
| Switched between lists | 21,12,600 | 43,08,756 | +104.0% |
| Orders from Watchlist rows | 2,34,492 | 12,21,288 | +420.8% |
| Discovered a list and added it | 13,101 | 11,05,782 | +8,340.4% |
| Orders from the Options list | — | 5,04,939 | New |
Event counts, before and after the June 2026 release.
[ Release 2 · August 2026 ]
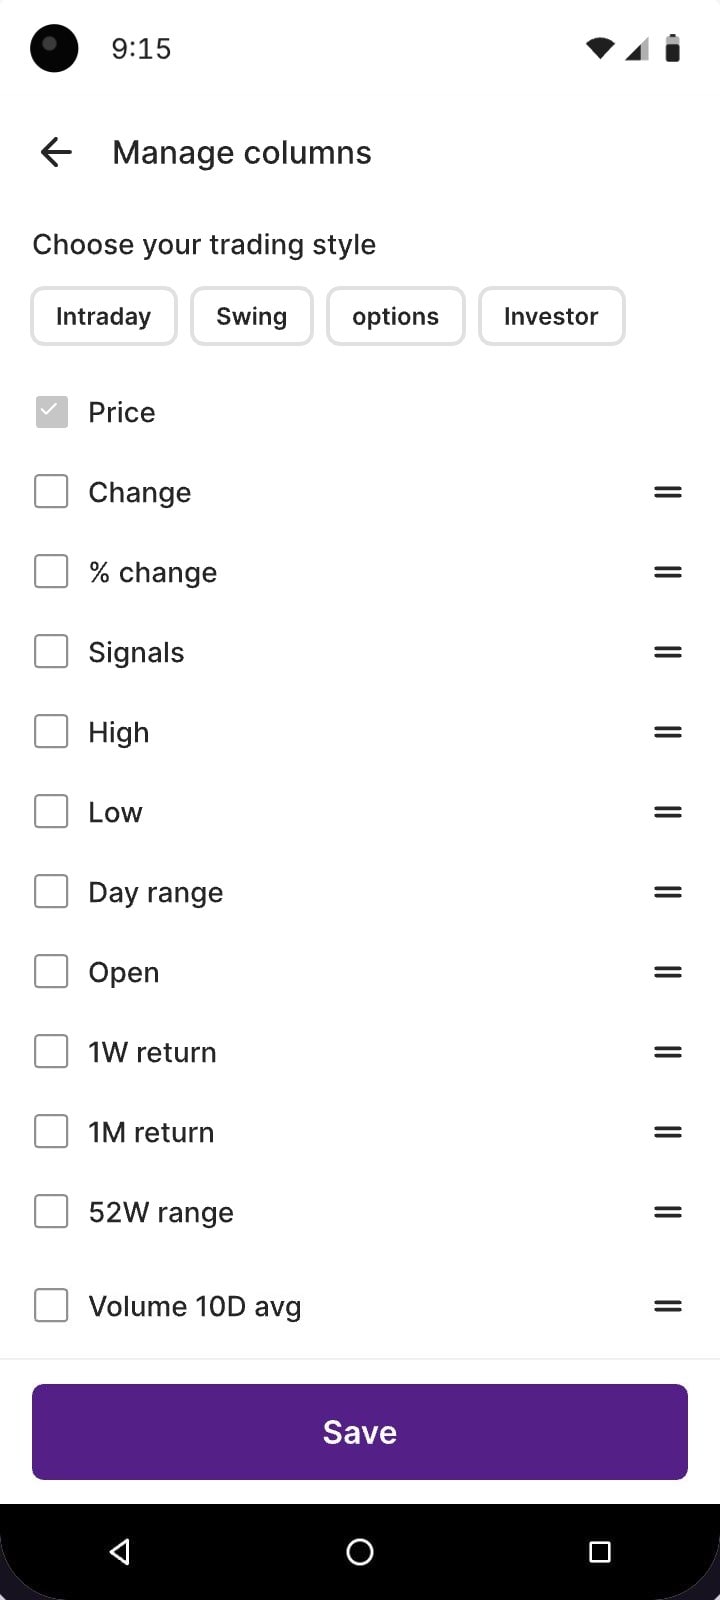
A multicolumn view, without loading data traders hadn’t asked for.
The initial idea
Keep the table inside My lists
One icon flips the list into columns and the choice sticks. Engineering flagged the cost: every reopen would load every column for every stock.

One trader, one session
5×
fewer column values to fetch when the table opens on demand.
What we designed first. Remembering the view meant every landing pulled every column for every stock.
What shipped. Column data is fetched only when someone asks for it, for one list.
Column values requested = stocks × columns × loads. The two shapes’ areas are to scale with each other. An illustration of the argument, not production numbers. Live prices stream either way.
Engineering’s suggestion
Table view on its own page, columns fetched on demand
We tried three ways in from My lists: an icon, a text link and a checkbox.
Three ways to reach the table
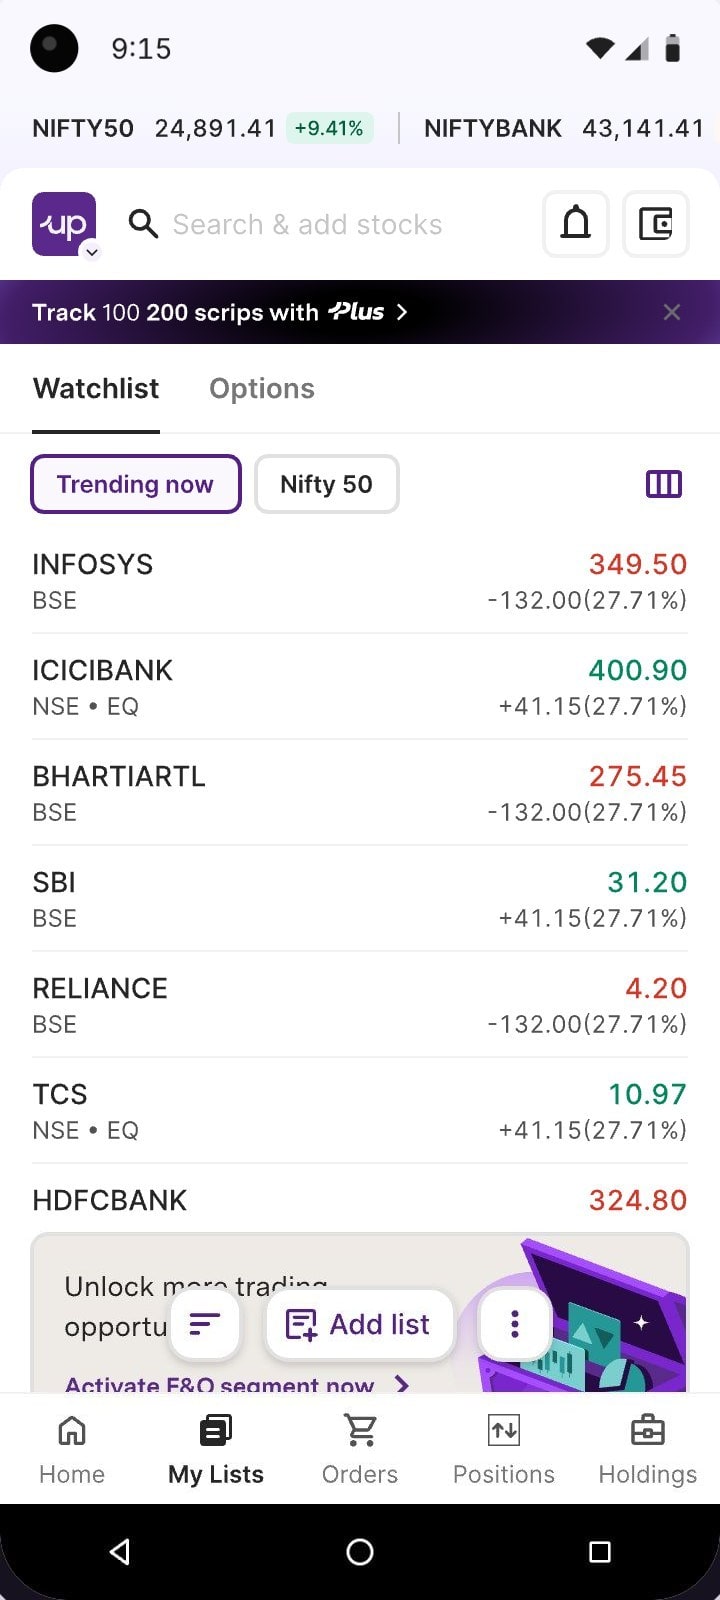
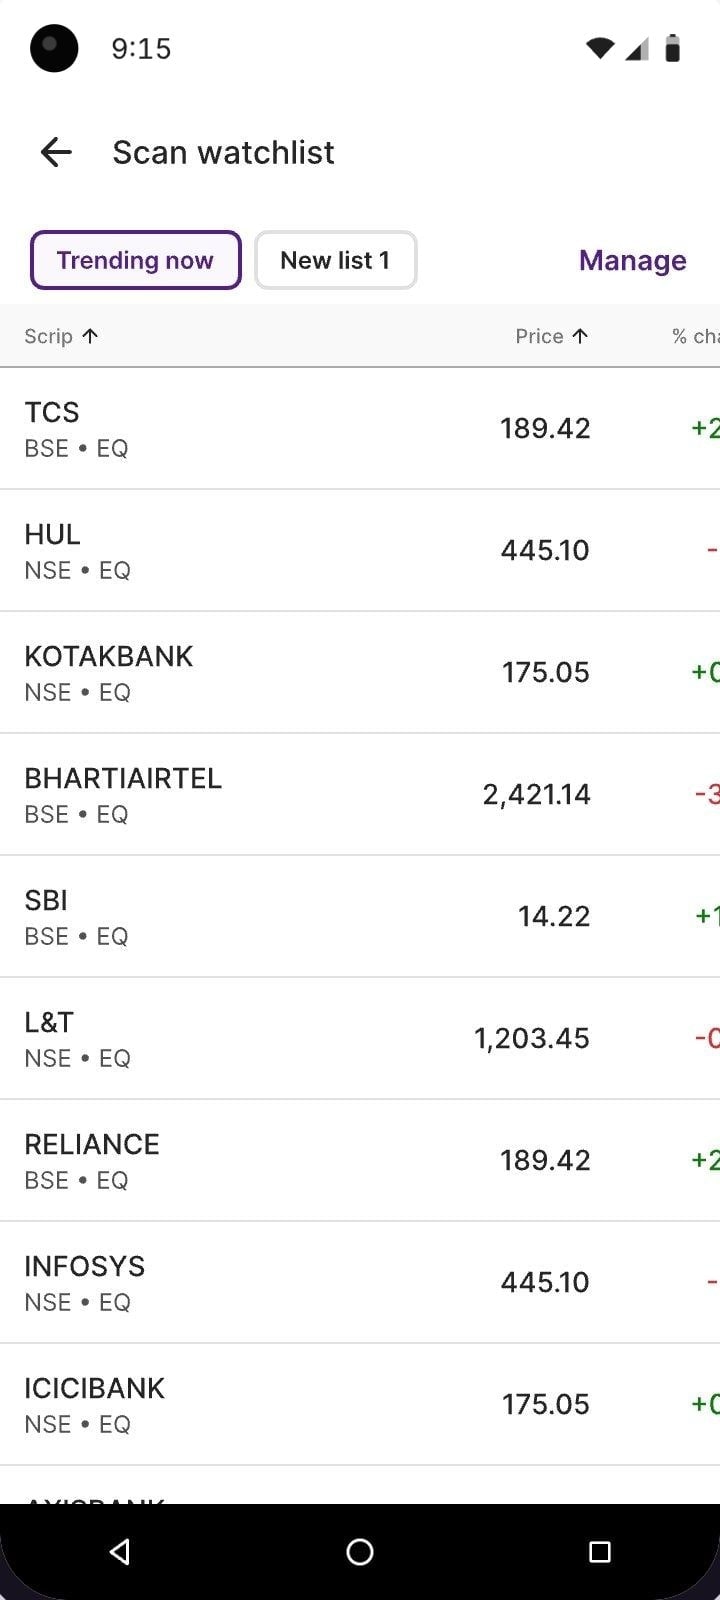
- Same icon as our first design, but it now leads to a separate page instead of changing My lists
Went live
Release 2 · What shipped
Live sinceAugust 2026
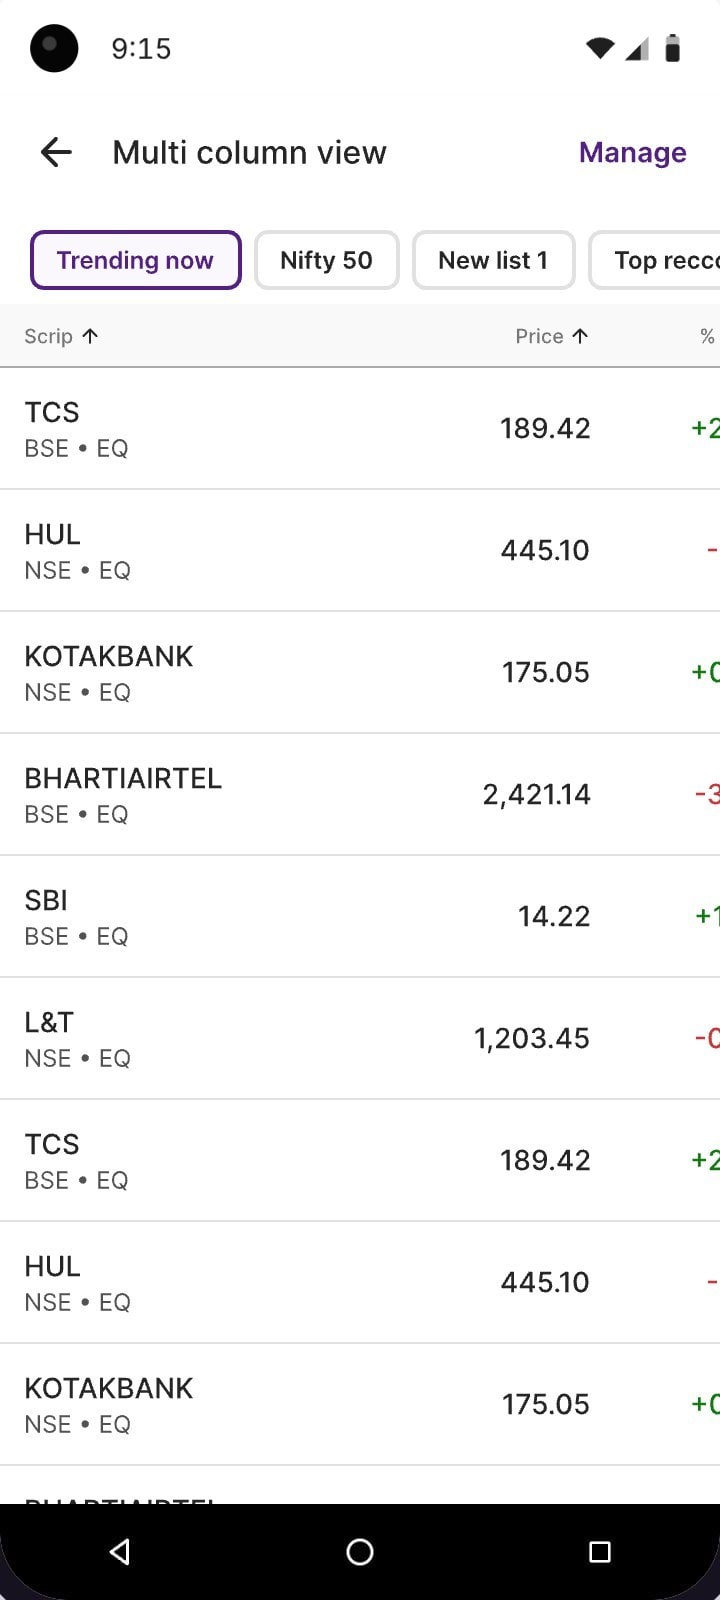
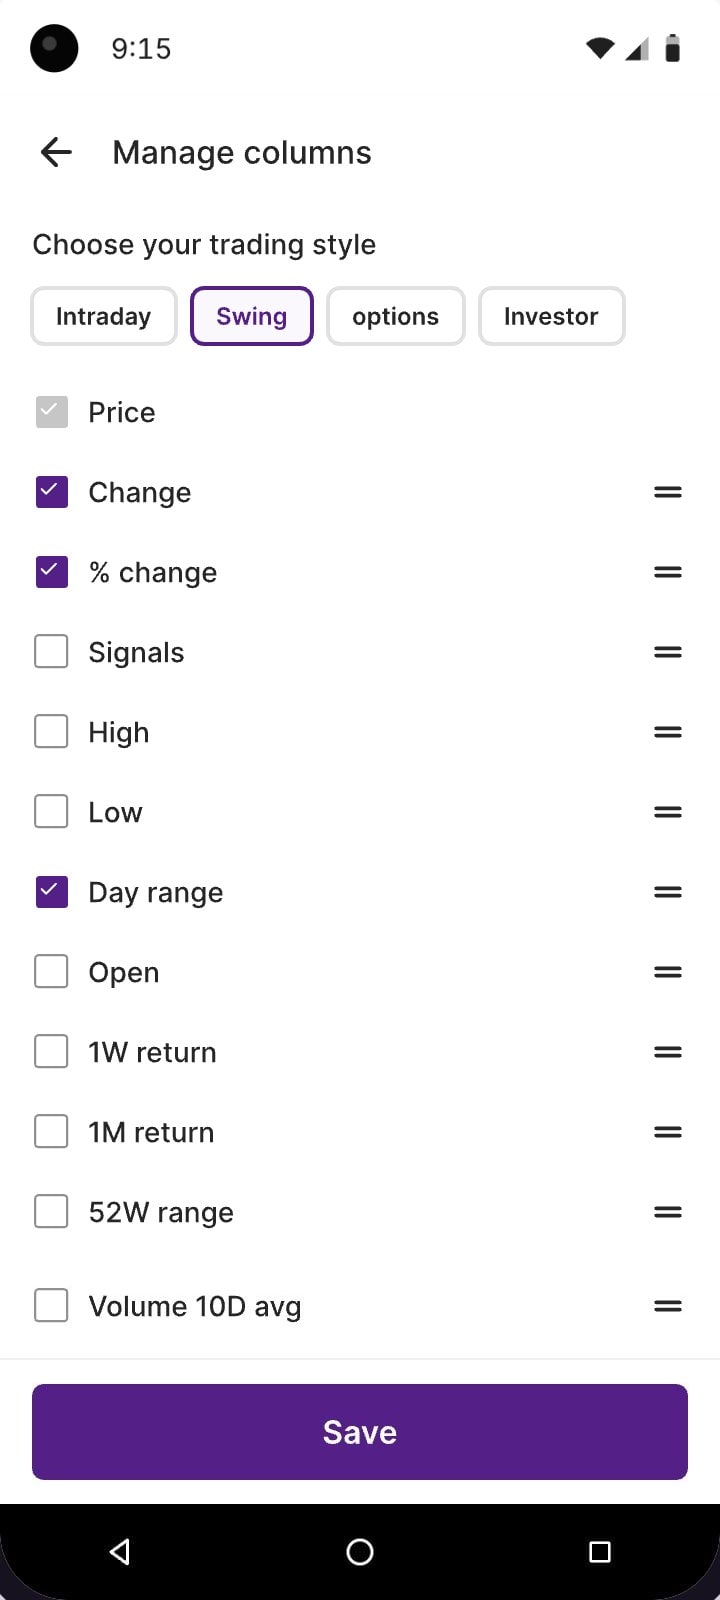
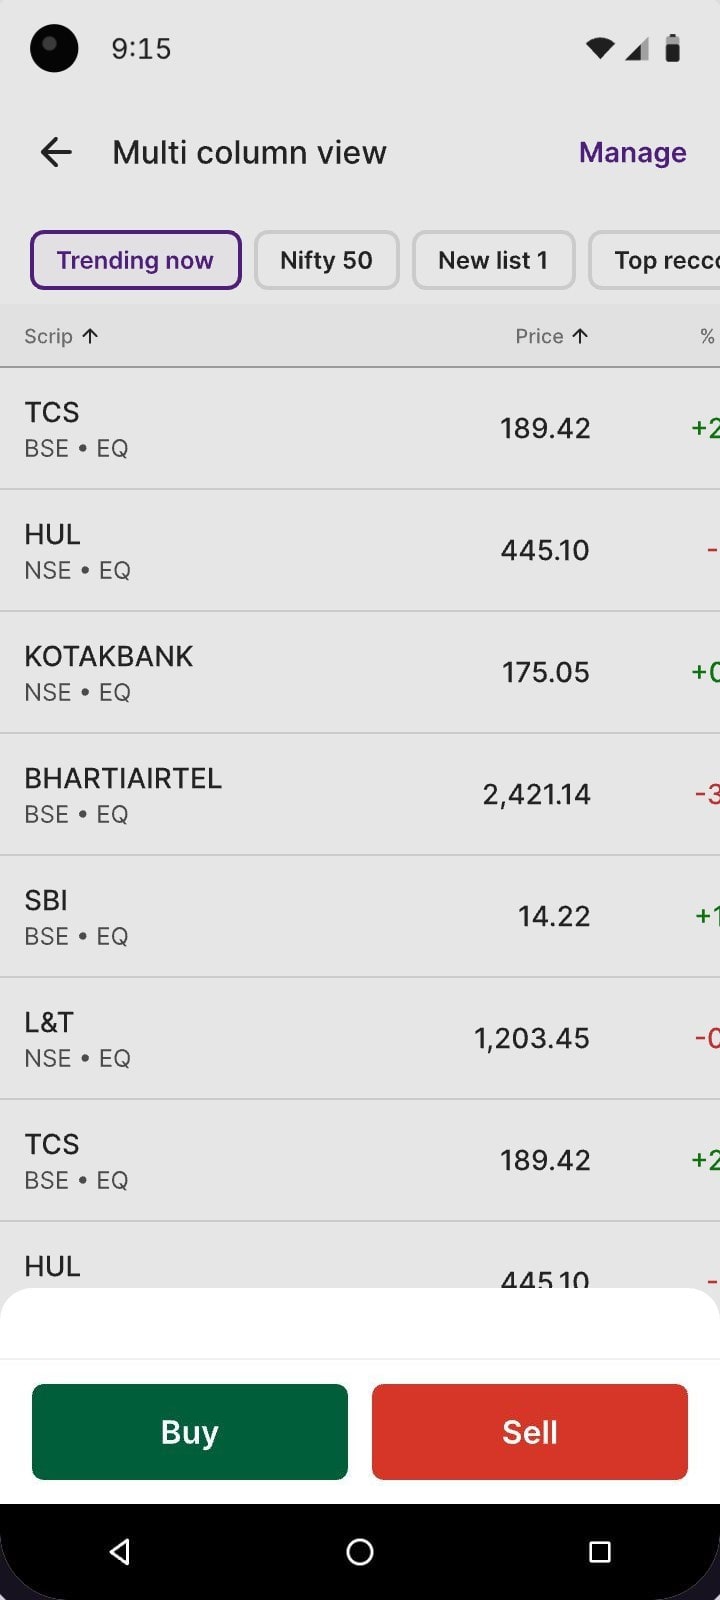
After launch in August 2026
- 36%
- of watchlist users open Table view
- 6,32,446
- users on the multicolumn layout
- 15.5+ min
- average time spent in the view
- 89,426
- orders placed from the view
Multicolumn view · as of 11 November 2026 · no earlier version to compare
[ Release 3 · October 2026 ]
Charts for the whole list, with one place for analysis tools.
The Analyze decision
No Chart icon in the bar. One Analyze button for both views.
A Chart icon would crowd the bar and every later feature would want one too. Table and Charts both analyse a list, so they share Analyze and future analysis tools join them there.
What the PMs and the business team asked for before launch: give Chart mode its own icon in the floating bar. It fixes one feature and sets the rule for every feature after it.
- Table viewShipped
- Chart modeShipped
- Watchlist newsBeing discussed
- The next ideaWhatever comes next
Try the shared controls
Set it once and every card follows

Layout
Chart
Interval
Indicators
Made-up prices. Change anything here and every chart redraws with it.
Made-up prices. Change anything above and every chart redraws with it.
Went live
Release 3 · What shipped
Live sinceOctober 2026
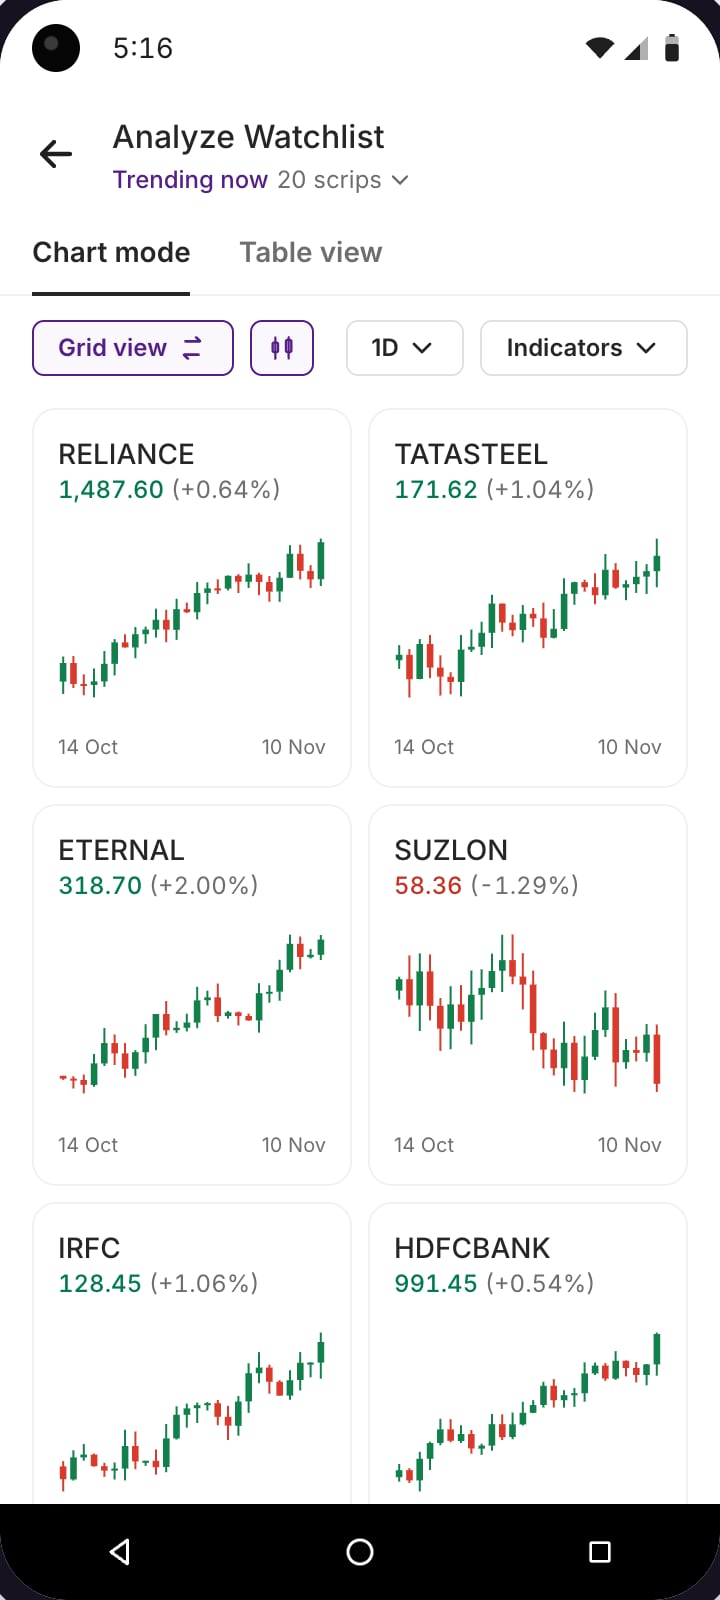
- Shared controlsTimeframe, chart type and indicators, set once for every card.
- Readable at card sizeAt most two overlays and one oscillator. No volume on index cards.
- A route into the full chartTap a card for that stock’s full chart, same settings.
After launch in October 2026
- 24.69%
- of watchlist users use Charts view daily
- 96,864
- people opening Charts view every day
- 43,872
- orders placed from Charts view since launch
Charts view · as of 11 November 2026 · no earlier version to compare

[ Version 4 · In development ]
The next changes came from using the charts, not from adding more features.
Release 3 · live
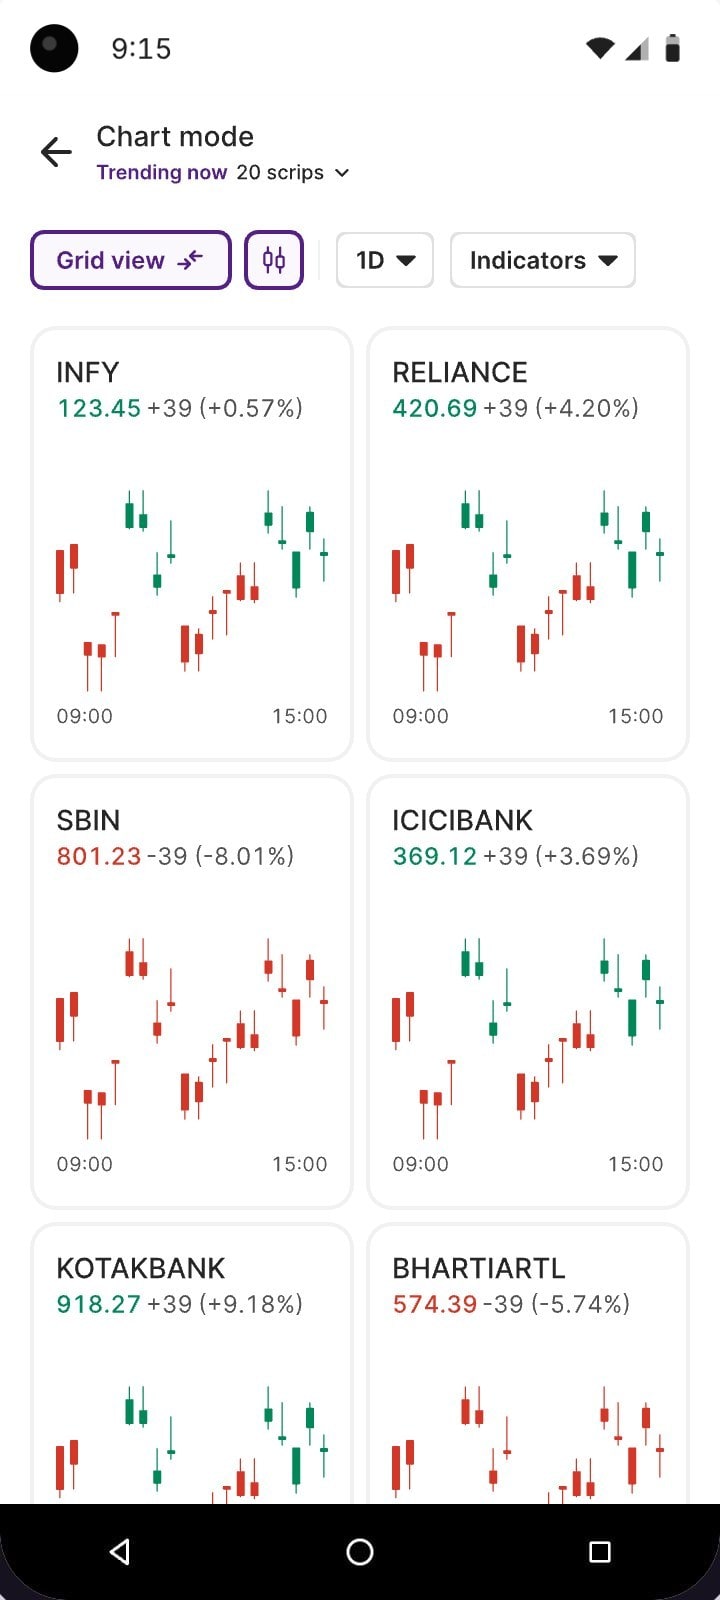
Version 4 · in development
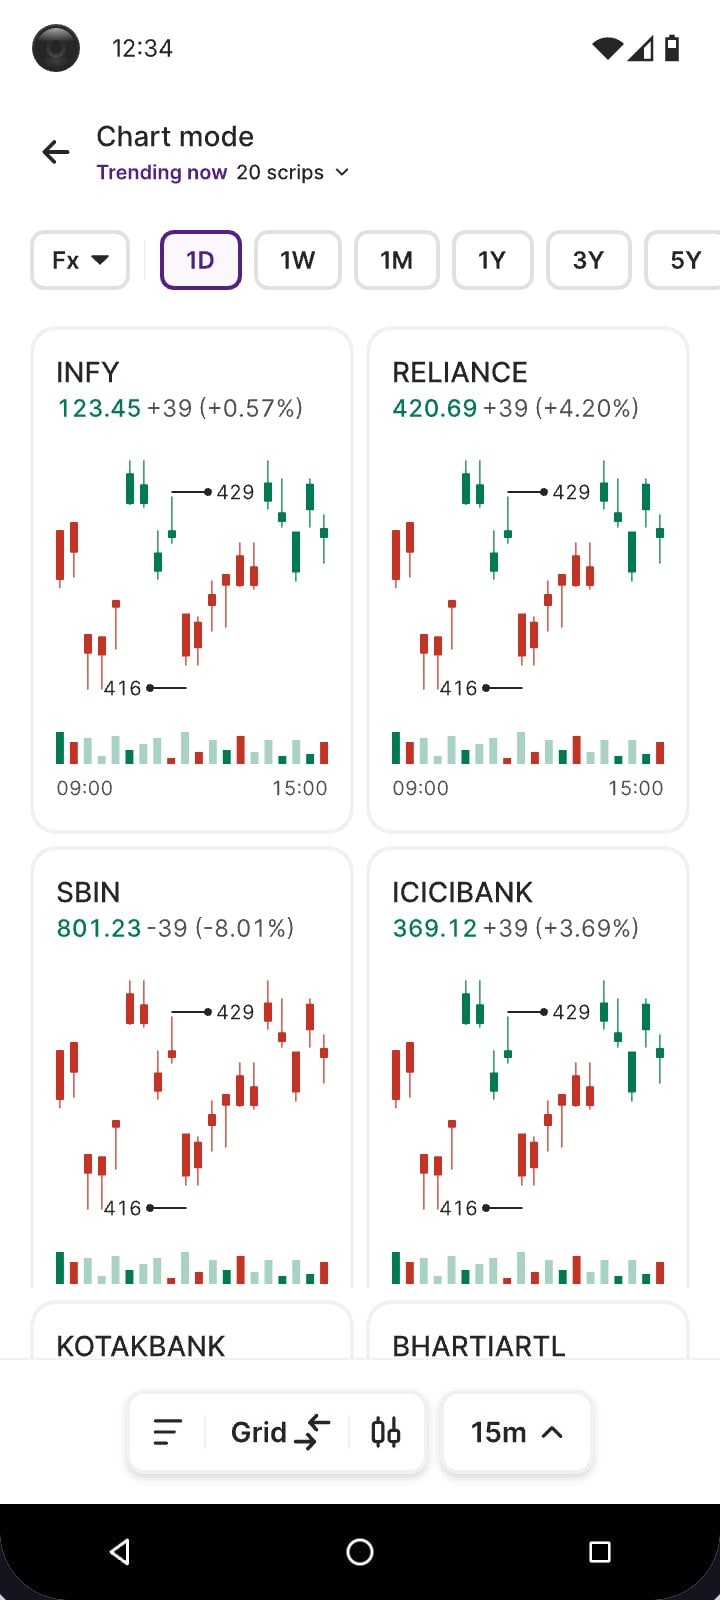
Both phones work: tap any control, card or tab.
Ships with version 4
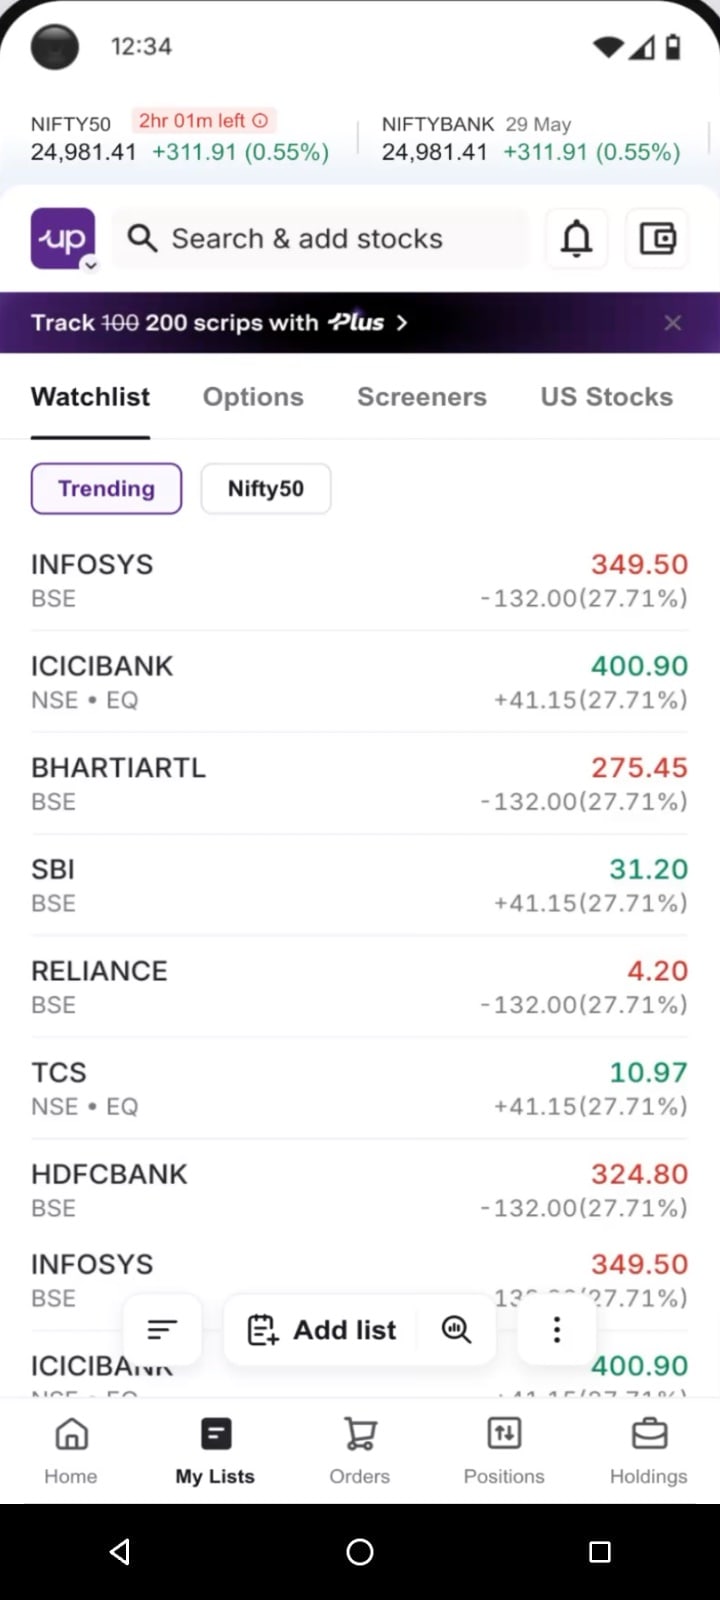
More of the list on screen while you scroll
Traders asked to see more stocks at once. Scroll down My Lists and the search bar and top tabs slide away and the floating bar shrinks to its icons. Scroll back up and everything returns.
[ Impact summary ]
The change showed up across the Watchlist journey.
The Watchlist started as a place to keep an eye on prices. Across three releases, it became easier to organise stocks, compare them and act from the list. The work also changed how I approached the product: each new capability had to fit the way traders already worked, the technical cost of supporting it and the space available on the screen.
[ What I learned ]
Two decisions shaped the work beyond the screens.
Treat technical constraints as design input
The table we first put inside My lists would have reloaded every column on every visit. Instead of pushing for it, we took engineering’s idea of a separate page and tried three ways to reach it from My lists.
Protect the screen and find an answer both sides can live with
Designers own the experience. When a PM wanted a Chart icon of its own in the floating bar, every visit would have carried one more choice and every later feature would have asked for the same. One Analyze button for Table and Charts gave the feature a clear home and kept the bar calm.
[ Next case study ]
2025

Making NPS feel simple
Turning a government portal, eight-step wizards and a captcha into a few guided taps inside Upstox.
- ₹34.6 Cr
- Assets under management
- 96.4K
- NPS accounts created
- 9.7L+
- Orders completed